
Merchant Portal | Dashboard Analytics
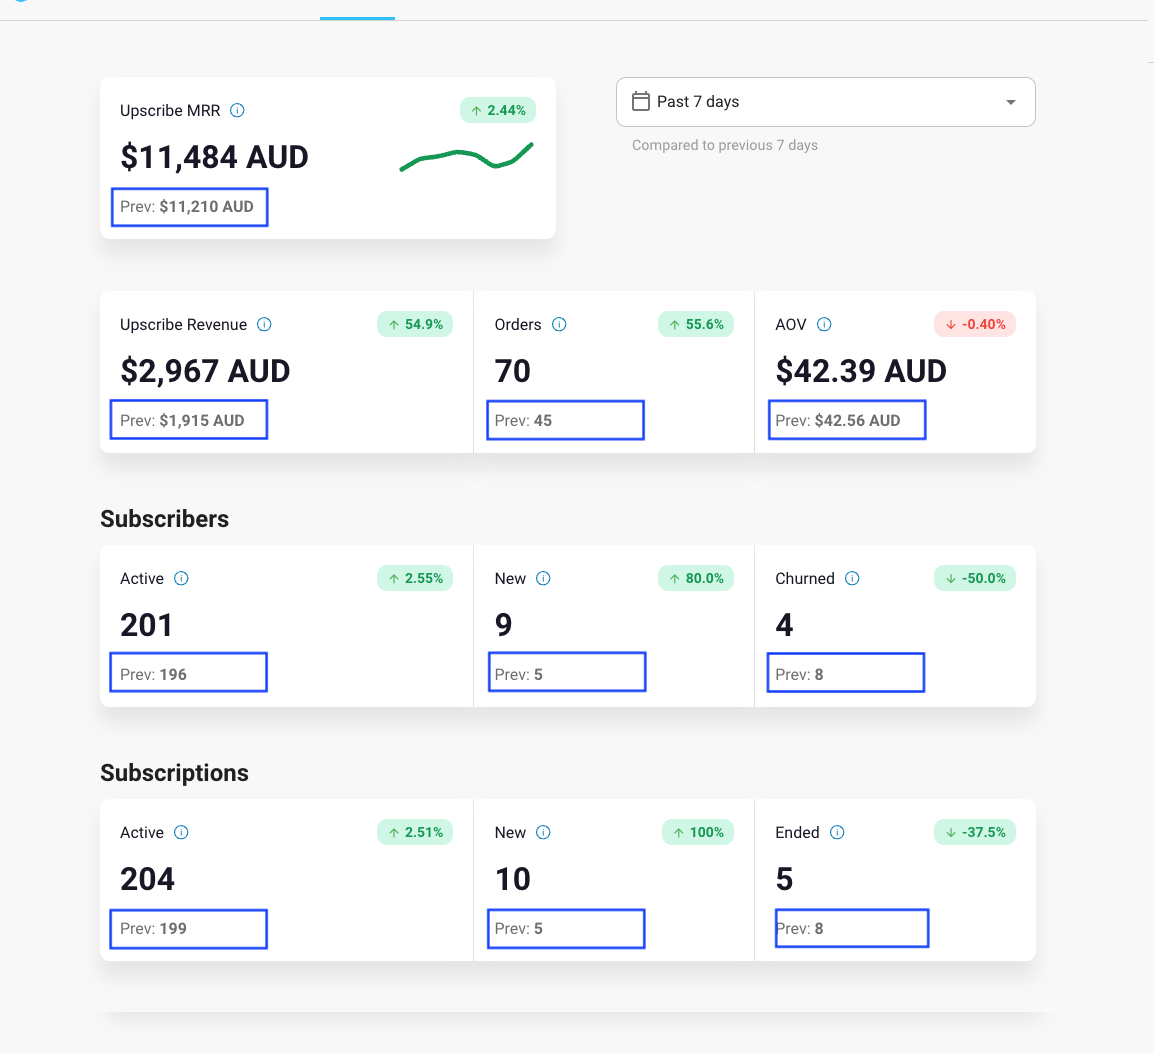
The dashboard landing page has data on revenue, orders, subscribers, and subscriptions. There are options to view different time frames and you can choose a custom time frame.

The data displayed for each section is as follows:
Revenue
1. Upscribe MRR - this is the total amount of Monthly Recurring Revenue Upscribe has facilitated in your date range. MRR is defined by a 30-day month. MRR only includes subscriptions
2. Upscribe Revenue - Revenue earned from subscription orders during this period (includes both subscriptions and one-off purchases)
Orders
3. Orders - number of subscription orders during this period.
4. AOV - Average Order Value - for all subscription orders during this period
Subscribers
5. Active - number of active subscribers who had one or more active subscribers at the end of the selected time period
6. New - number of new or reactivated subscribers at the end of the selected time period
7. Churned - number of subscribers who were active at the beginning of the selected time period but ended all subscriptions before the end of the selected time period. This could be ended via pause, cancel or failure
Subscriptions
8. Active - active subscriptions for the previous period + new subscriptions for the selected time period - ended subscriptions for the selected time period = Active Subscriptions for the selected time period
9. New - number of new or reactivated subscriptions during the selected time period
10. Ended - number of subscriptions that were active at the beginning of this time period, but became canceled, paused, or failed at the end of the current period
Note
For the entire order-related row (#2 Upscribe Revenue, #3 Orders, and #4 AOV), the numbers include:
- all subscription-related orders in the time period which includes both first-time subscription orders and any recurring subscription orders that fall in the selected time frame.
This means we do consider non-subscription revenue from the first-time subscription orders as part of Upscribe revenue. We do not include revenue from non-subscription orders.
Compare Analysis
The dashboard will automatically compare your analytics to the previous time frame you have selected. For example:
- If you view the dashboard for the "Past 7 days", the "Prev #" will display the 7 days prior
- If you view the dashboard for "June 15-July 15", the "Prev #" will display the 31 days prior
Data Export
For more comprehensive reporting, merchants can pull exported report under Settings > Advanced Settings > Export Data

Once there, you'll notice Upscribe has 3 export report options: subscriptions, subscribers, orders and upcoming orders.

1. To begin choose your export type:2. Use the selectors to choose your date range and the specific filter of the export. If no filter is selected the export will include all relevant data.
 3. Click Export - Optionally, you can change the report name in the box highlighted below. The default will be the selected report + the selected date range.
